Instruments Tool
Instruments is a powerful and flexible performance-analysis and testing tool. It is a part of the Xcode tool set. Instruments tool is designed to help you profile your iOS applications in order to increase their performance and better utilization of resources.
We will see
- How to find hot-spots in code using Time profiler instrument.
- How to find and fix the memory problems like strong reference cycle using Allocations instrument.
- How to reduce the memory waste by finding the abandoned memory in application using Allocations instrument.
- Finding memory allocations which are deal located and still referenced by our application using Zombies instrument.
Launch Instruments from Xcode
To launch Instruments from the Xcode menu
- Open Xcode.
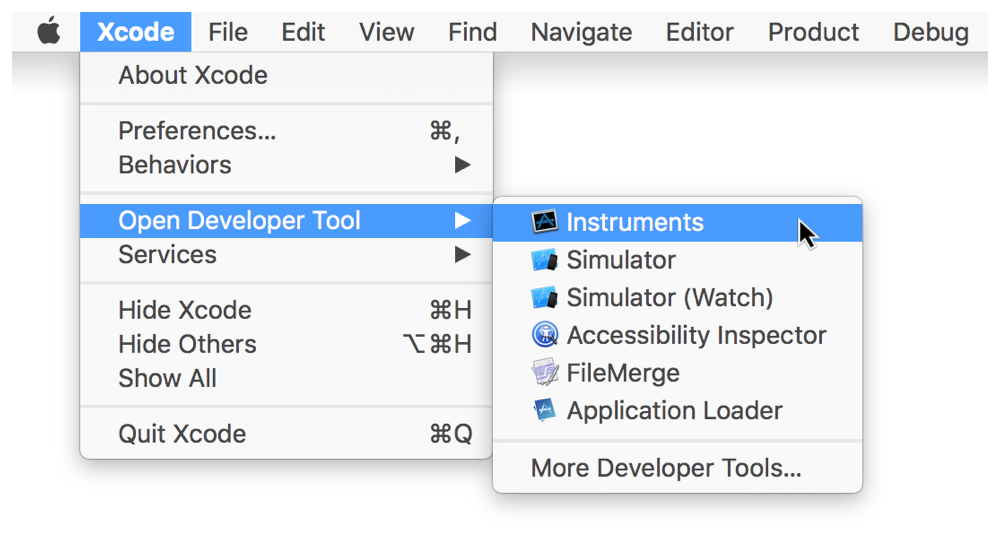
- Choose Xcode > Open Developer Tool > Instruments.
To profile an opened Xcode project
- Launch Xcode and open your project.
- Do one of the following:
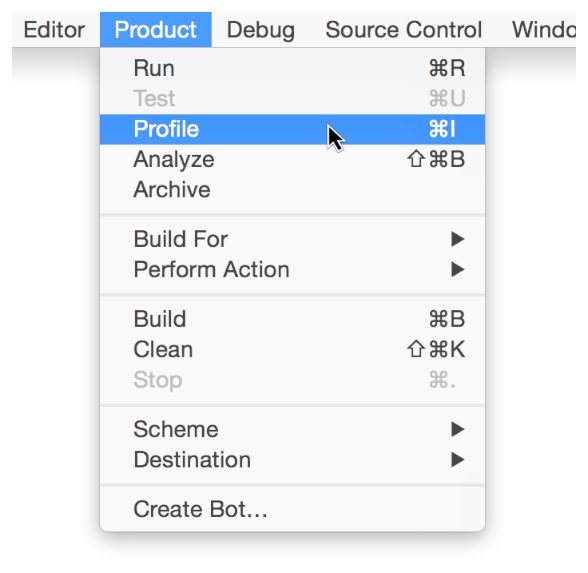
- Choose Product > Profile.
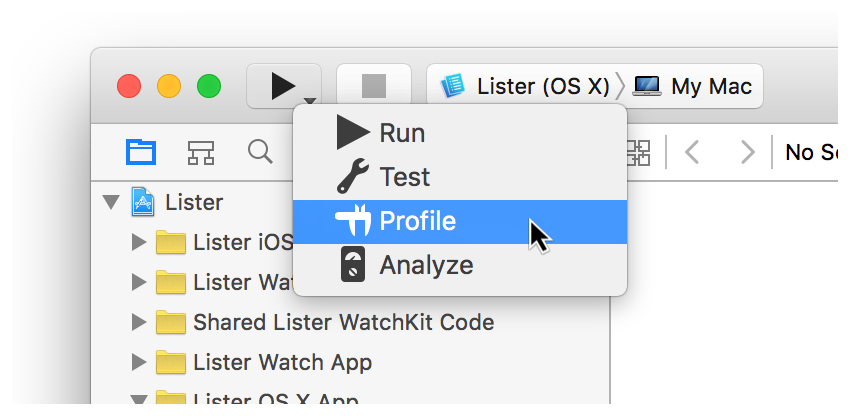
- Click and hold the Run button in the Xcode toolbar and choose Profile.
- Press Command+I.
Xcode builds your project, Instruments launches, and you’re prompted to select a profiling template.
Instruments Tool sections
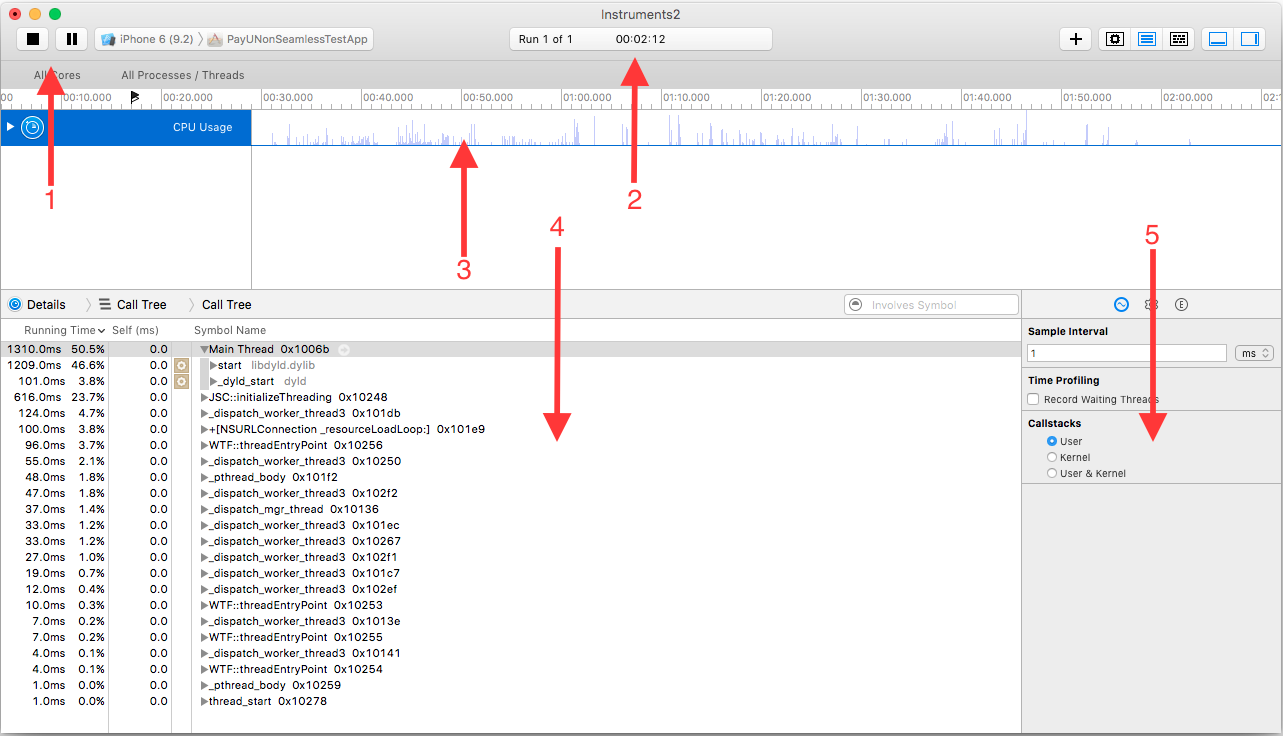
- Recording control: Start/Stop and Pause the recording.
- Timer: Running time and number of times application tested.
- Track: Graphical Representation for selected tool w.r.t. time.
- Details Panel: Detail output of the particular instrument.
- Inspectors Panel: Record Setting, Display Setting and Extended Details.
CPU Uses
In Instruments tool, we can conduct testing under variety of conditions. We can also identify that how well the application uses the threads, cores and other resources. We can balance the work with multiple threads and offload work from main thread making our app more responsive. The Time Profiler instrument shows how well an application utilizes CPU cores and threads.
Steps to find CPU Use
- Launch Instruments tool using any one of the methods described above.
- When it asks to select a template, click Time Profiler.
- Choose your device and app from the target device and process lists if they are not selected.
- Click the Red Record button in the toolbar or press Command+R to begin recording.
- Use your app or the system normally.
- Click the Black Stop button in toolbar or press Command+R again when complete.
- Click the CPU or threads strategy button in the trace document toolbar.
- Examine the collected data.
In Detail panel, you can see the time take by each method in your application. if you want to open code then you can double click on any method and if you want to edit the code you can click small xcode icon and modify the code where needed.
Memory Leak
When we allocate some memory in our application but we never release them and the memory no longer being referenced by your app then this is called memory leak. Since we do not have any reference to that allocated memory, we cannot release it and the memory cannot be used again by application. In Instruments tool, we have Leaks template to find the memory leaks in an application.
Steps for finding memory leaks
- Launch Instruments tool using any one of the methods described above.
- When it asks to select a template, click Leaks.
- Choose your device and app from the target device and process lists if they are not selected.
- Click the Red Record button in the toolbar or press Command+R to begin recording.
- Use your app normally.
- Watch the Leaks instrument in the timeline pane for leaks. A leak appears as a red bar.
- Click the Leaks instrument in the timeline pane to display leak-related information in the detail pane.
- Choose Call Tree from the detail type list in the navigation bar of the detail pane. This displays a list of method calls related to any detected leaks.
- Press Command+2 to show the display settings area of the inspector pane.
- Under the Call Tree display settings, select Invert Call Tree and Hide System Libraries.
- In the call tree, select a method call you want to investigate.
- Press Command+3 to display a stack trace for the selected method call in the extended detail area of the inspector.
- Double-click the method call in the stack trace to display its code in Instruments.
- Click the small Xcode button at the top of the detail pane to open the code in Xcode for review and editing.